
For Immediate Release |
The Inventor of MR Scanning |
An ISO 9001 Company |
|
| Contact: Daniel Culver | 110 Marcus Drive |
| Director of Communications | Melville, NY 11747-4292 |
| Web site: www.fonar.com | Phone: (631) 694-2929 |
| Email: investor @ fonar. com | Fax: (631) 390-1709 |
MELVILLE, NEW YORK, September 27, 2022 - FONAR Corporation (NASDAQ-FONR), The Inventor of MR Scanning™,reported today its fiscal 2022 results. FONAR’s primary source of income is attributable to its wholly-owned diagnostic imaging management subsidiary, Health Management Company of America (HMCA). In 2009, HMCA managed 9 MRI scanners. Currently, HMCA manages 41 MRI scanners in New York and in Florida.
Financial Results
Total revenues - Net increased by 9% to $97.6 million for the fiscal year ended June 30, 2022, as compared to $89.9 million for the fiscal year ended June 30, 2021.
Total Costs and Expenses for the fiscal year ended June 30, 2022 increased by 4% to $75.6 million, as compared to $72.8 million for the fiscal year ended June 30, 2021.
Revenues from the management of the diagnostic imaging center segment, consisting of patient fee revenue net of contractual allowances and discounts, and management and other fees of related and non-related medical practices, increased to $89.4 million for the fiscal year ended June 30, 2022, as compared to $80.9 million for the fiscal year ended June 30, 2021.
Revenues from product sales and upgrades and service and repair fees for related and non-related medical parties, for the fiscal year ended June 30, 2022 was $8.2 million, as compared to $9.0 million for the fiscal year ended June 30, 2021.
Research and Development expenses decreased 9% to $1.5 million for the fiscal year ended June 30, 2022, as compared to $1.6 million for the fiscal year ended June 30, 2021. The reasons for the decrease in R&D include supply-chain-related delivery delays due to the COVID-19 pandemic.
Selling, general and administrative (S,G&A) expenses decreased 5% to $23.5 million for the fiscal year ended June 30, 2022, as compared to $24.7 million for the fiscal year ended June 30, 2021. This decrease was due to service contracts, management fees and other receivables impacted by the COVID-19 pandemic in the prior fiscal year.
Income from Operations increased 29% to $22.0 million for the fiscal year ended June 30, 2022, as compared to $17.1 million for the fiscal year ended June 30, 2021.
Net Income increased 26 % to $17.2 million for the fiscal year ended June 30, 2022, as compared to $13.7 million for the fiscal year ended June 30, 2021.
Diluted Net Income per Common Share available to common shareholders increased 21% to $1.75, for the fiscal year ended June 30, 2022, as compared to $1.45 for the fiscal year ended June 30, 2021.
The weighted average diluted shares outstanding for the fiscal year ended June 30, 2022 increased 1% to 6.7 million versus 6.6 million for the fiscal year ended June 30, 2021.
Balance Sheet Items
Total Cash and Cash Equivalents and Short Term Investments at June 30, 2022 increased 10% to $48.8 million as compared to the $44.5 million at June 30, 2021.
Total Assets at June 30, 2022 were $199.3 million as compared to $189.5 million at June 30, 2021.
Total Liabilities at June 30, 2022 were $53.1 million as compared to $54.1 million at June 30, 2021.
Total Current Assets at June 30, 2022 were $118.7 million as compared to $108.6 million at June 30, 2021.
Total Current Liabilities at June 30, 2022 were $16.7 million as compared to $20.0 million at June 30, 2021.
The Current Ratio is 7.2 at June 30, 2022.
FONAR Stockholders’ Equity was $150.3 million at June 30, 2022, as compared to $138.4 million at June 30, 2021.
Working Capital increased 15% to $102.1 million at June 30, 2022, as compared to $88.5 million at June 30, 2021.
The ratio of Total Assets / Total Liabilities increased 7% to 3.8 at June 30, 2022 as compared to 3.5 at June 30, 2021.
Net Book Value per Common Share (Total Stockholders Equity divided by Common Shares Outstanding) increased 7% to $21.89 at June 30, 2022 as compared to $20.41 at June 30, 2021, one year ago..
Cash Item
Operating Cash Flow was $15.3 million for the fiscal year ended June 30, 2022 as compared to $19.1 million for the fiscal year ended June 30, 2021.
Management Discussion
Timothy Damadian, president and CEO of FONAR, said: “As this is my first statement in a press release since the recent passing of my beloved father, Dr. Raymond V. Damadian, I will take this opportunity to honor him. Dr. Damadian made medical history in 1971 with the scientific discovery that created the MRI industry. Every MRI picture ever made hinges on that discovery. He built the world’s first MRI scanner in 1977, created the world’s first MRI company in 1978 (which would later be named FONAR Corporation), and produced and sold the world’s first commercial MRI in 1980. It was a struggle for the company from its inception, as it had to compete with powerful, well-heeled corporate giants, including Johnson & Johnson, General Electric, Hitachi and Siemens. It truly was a David versus Goliath battle. Yet through technological innovations, extraordinary perseverance, the help of devoted family members, friends and employees, and God’s blessing and support, Dr. Damadian was able to keep FONAR afloat. The company had its ups and downs for many years, eventually achieving consistent profitability.”
“Based on Dr. Damadian’s fundamental discovery, the ever-expanding diagnostic capabilities of MRI technology have enabled medical practitioners the world over to dramatically improve the quality of healthcare and, in fact, save countless numbers of lives. To this day, over 40 years since FONAR introduced the first commercial MRI scanner, MRI remains a premiere diagnostic imaging tool, and the term “MRI” is now a household word. Today, we at FONAR and HMCA gratefully enjoy the fruits of my father’s genius, tenacity, and tireless devotion and are committed to honor him with continuing success.”
“Regarding the results of fiscal 2022,” Mr. Damadian said, “I am pleased that MRI scan volume at HMCA-managed MRI centers in fiscal 2022 marked our full return to pre-COVID-19 levels. Scan volume in pre-COVID fiscal 2019 was 184,028. Scan volume in fiscal 2022 was 186,448. While a three-year recovery period may at first glance seem like a long time, it is actually something we at HMCA are proud of.
“The pandemic took its greatest toll on our business in fiscal 2020. As the result of decreased patient volume, employee sicknesses, quarantine restrictions, reduced business hours, staffing shortages, etc., scan volume fell by 9% compared to the previous year, from 184,028 to 166,698 scans. Since then we have recovered steadily: Scan volume increased by 7% in fiscal 2021 (from 166,698 to 178,364) and then by 5% in Fiscal 2022 (from 178,364 to 186,448).”
“It’s noteworthy that our recovery has been achieved in spite of COVID-19’s continuing negative effect on our business. While the rate of infections from COVID-19 and it variants has been decreasing, some of our centers continue to face an unrelenting shortage of qualified workers, which has prevented them from returning to their regular pre-COVID-19 business hours and, consequently, scan volumes.”
“However, since fiscal 2020 we added some new centers and installed “second MRIs” at some of our existing high-volume MRI centers. Most recently, in fiscal 2022, we installed “additional MRIs” in Pembroke Pines, Florida, and Manhattan, New York. These new centers and the addition of “second MRIs” have helped to offset the volume losses at our short-staffed sites. Looking ahead, by the end of this calendar year we expect to have added two more centers, one in the Bronx, New York and then one in Central Florida.”
“I am grateful to our management team and all the HMCA employees who have kept us on the road to recovery and for consistently doing their very best to cope with the ongoing negative impact of the pandemic. Although we can’t predict what the economy, the labor force, and the continuing effects of COVID-19 or its variants will look like in fiscal 2023, I am confident, judging from our history, that we will do what needs to be done to keep the company profitable.”
Significant Events
On September 13, 2022, the Company adopted a stock repurchase plan. The plan has no expiration date and cannot determine the number of shares which will be repurchased. On September 26, 2022, the Board of Directors approved up to $9 million to be repurchased under the plan which will be purchased on the publicly traded open market at prevailing prices.
With the passing of Raymond Vahan Damadian, M.D., FONAR employees, customers, shareholders and their families, and the world at large have lost a brilliant and caring physician and inventor. He started the MRI industry with the founding of Fonar Corporation in 1978, the first Company to install the first of thousands of MRI scanners in America and the world.
In 1960 Dr. Damadian chose to pursue research after graduating from Albert Einstein College of Medicine. His interests were in cellular biology. That pursuit led him to become familiar with Nuclear Magnetic Resonance (NMR), a technology that analyzed samples in a test tube. In 1969 he conceived the idea for MRI. It was during the following year, on June 18, 1970, that he performed the first experiments whereby he discovered the distinctly elongated, time-lapsed signal marking the differences between normal and cancerous tissue, as well as the differences among various normal organs themselves. It is these signal differences that make the MRI image. At the time, Dr. Damadian called this his ‘Eureka!’ moment. This discovery of the differences in T1 and T2 relaxation times, underpins tissue contrast in each and every MRI image ever produced and is the foundation of the MRI industry.
On March 19, 1971, Dr. Damadian published his discovery in the peer-reviewed journal ‘Science’. In 1987, the Institute for Scientific Information, Philadelphia, PA, whose specialty is citation indexing, recognized Dr. Damadian’s ‘Science’ Journal article as a ‘Citation Classic’ because of the frequency that it was referenced by other Scientist-Authors in the field.
On March 17, 1972, Dr. Damadian filed U.S. Patent 3,789,832 (Cancer Detection Patent) where he described the use of the T1 and T2 relaxations as a method for detecting cancer and providing the first method ever for accomplishing a scan of the live human body. It also provides the first method ever for a means of achieving the needed 3D spatial localization necessary to accomplish a body scan. It describes the method of using this localization to scan the live human body to detect cancer. The patented scanning method accomplishes the 3D spatial localization of a voxel-by-voxel acquisition by the combined shaping of the static and RF magnetic fields.
On July 3, 1977, Dr. Damadian and his two graduate students, Lawrence Minkoff, Ph.D. and Michael Goldsmith, Ph.D., made the world’s first MRI scan, that of Dr. Minkoff’s chest. They achieved it on the world’s first MRI scanner, they named Indomitable. This world’s first MRI scan accomplished Dr. Damadian’s 1969 dream of scanning the human body. He had successfully taken NMR from a test tube-size device to a human-size device.
Other highlights of FONAR Corporation, while Dr. Damadian was president and chairman of the board, include:
Dr. Damadian's invention of the Magnetic Resonance Imaging (MRI) scanner has earned him top awards including the United States National Medal of Technology from President Ronald Reagan (1988). He was inducted into the National Inventors Hall of Fame (1989) joining others such as Thomas Edison, Alexander Graham Bell and the Wright brothers. He received the Lemelson-MIT program Lifetime Achievement Award (2001) as the man who invented the MRI scanner. His first MRI machine "Indomitable" is part of the Smithsonian Institution collection (1987).
Dr. Damadian received the Benjamin Franklin Medal and Bower Award for Business Leadership (2004) for his contribution to the origination of MR scanning.
The Intellectual Property Owners Education Foundation presented Dr. Damadian with the 2007 National Inventor of the Year Award for his development of UPRIGHT® MRI technology.
He received the Excellence in Medicine award (2018) from the Chiari & Syringomyelia Foundation (CSF). Perhaps Professor Donlin Long, M.D., former Chairman of Neurosurgery, Johns Hopkins University, said it best: MRI is “The single most important diagnostic discovery in the history of all of medicine.” Professor Long made this statement on November 10, 2018, when Dr. Damadian was awarded the Excellence in Medicine Medal of Honor from the Chiari & Syringomyelia Foundation at Brooks’s in London, England. He was joined by Fraser Henderson, M.D., a neurosurgeon and member of the steering committee for the Chiari & Syringomyelia Foundation, who said, “Raymond Damadian revolutionized medicine with the discovery and development of MRI.”
During 2011, Dr. Damadian reported on a study utilizing FONAR’s UPRIGHT® MRI that showed eight patients with Multiple Sclerosis (MS) had degenerative changes in their cervical spines that impinged on the spinal canal and limited the pulsatile flow of the cerebrospinal fluid (CSF) lubricating the brain and spinal cord. His team was able to view this CSF flow in and out of the brain with the patients positioned both lying down and upright. It was increased resistance to the outflow of CSF, he suggested, that played a role in the development of MS in these patients.
This work became one of the catalysts for Dr. Damadian’s intense interest, during the later part of his life, in how the human body’s position influences CSF circulation between the brain and spinal canal. When the FONAR UPRIGHT® MRI was used to examine patients and visualize these differences, the results revealed a promising indication for future studies to investigate the CSF-posture correlation in brain waste clearance and aging, as well as in a range of different neurodegenerative ailments.
About FONAR
FONAR, the Inventor of MR Scanning™, located in Melville, NY, was incorporated in 1978, and is the first, oldest and most experienced MRI company in the industry. FONAR introduced the world’s first commercial MRI in 1980, and went public in 1981. FONAR’s signature product is the FONAR UPRIGHT® Multi-Position™ MRI (also known as the STAND-UP® MRI), the only whole-body MRI that performs Position™ Imaging (pMRI™) and scans patients in numerous weight-bearing positions, i.e. standing, sitting, in flexion and extension, as well as the conventional lie-down position. The FONAR UPRIGHT® MRI often detects patient problems that other MRI scanners cannot because they are lie-down, ”weightless-only” scanners. The patient-friendly UPRIGHT® MRI has a near-zero patient claustrophobic rejection rate. As a FONAR customer states, “If the patient is claustrophobic in this scanner, they’ll be claustrophobic in my parking lot.” Approximately 85% of patients are scanned sitting while watching TV.
FONAR has new works-in-progress technology for visualizing and quantifying the cerebral hydraulics of the central nervous system, the flow of cerebrospinal fluid (CSF), which circulates throughout the brain and vertebral column at the rate of 32 quarts per day. This imaging and quantifying of the dynamics of this vital life-sustaining physiology of the body’s neurologic system has been made possible first by FONAR’s introduction of the MRI and now by this latest works-in-progress method for quantifying CSF in all the normal positions of the body, particularly in its upright flow against gravity. Patients with whiplash or other neck injuries are among those who will benefit from this new understanding.
FONAR’s primary source of income and growth is attributable to its wholly-owned diagnostic imaging management subsidiary, Health Management Company of America (HMCA) www.hmca.com.
FONAR’s substantial list of patents includes recent patents for its technology enabling full weight-bearing MRI imaging of all the gravity sensitive regions of the human anatomy, especially the brain, extremities and spine. It includes its newest technology for measuring the Upright cerebral hydraulics of the cerebro-spinal fluid (CSF) of the central nervous system. FONAR’s UPRIGHT® Multi-Position™ MRI is the only scanner licensed under these patents.
UPRIGHT® and STAND-UP® are registered trademarks. The Inventor of MR Scanning™, CSP™, Multi-Position™, UPRIGHT RADIOLOGY™, The Proof is in the Picture™, pMRI™, CSF Videography™, Dynamic™, are trademarks of FONAR Corporation.
This release may include forward-looking statements from the company that may or may not materialize. Additional information on factors that could potentially affect the company's financial results may be found in the company's filings with the Securities and Exchange Commission.
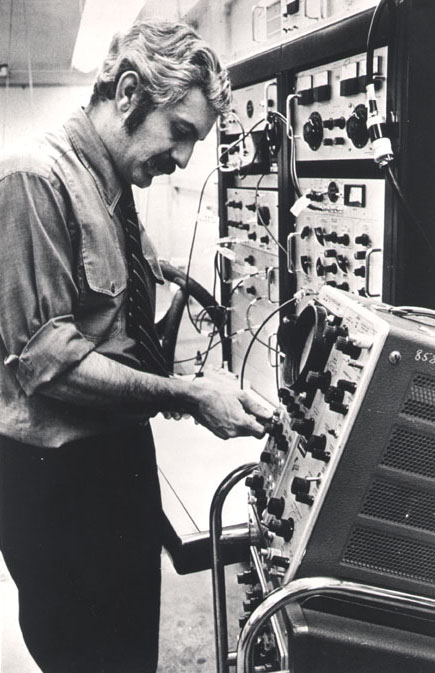
Above, Dr. Damadian looking at an instrument called an
oscilloscope while measuring T1 and T2 signals on an NMR test tube-size instrument.
Picture: Fonar Corporation
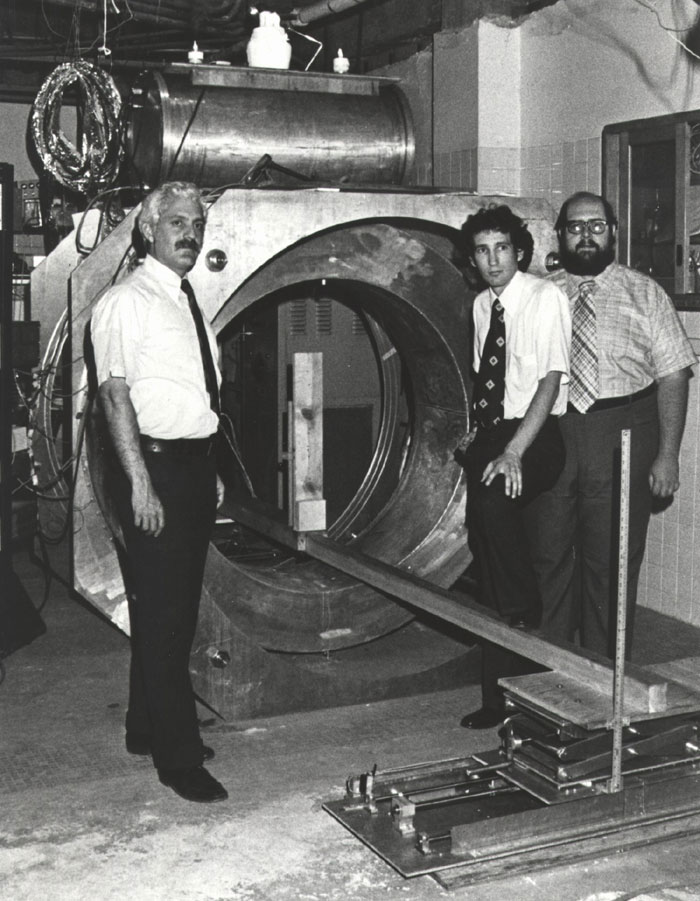
Above, Dr. Damadian and his graduate students, Lawrence
Minkoff, Ph.D. and Michael Goldsmith, Ph.D. with the world’s first MRI
machine, they named ‘Indomitable.’
On July 3, 1977, they completed the world’s first MRI scan of the human
body, that of Dr. Minkoff’s chest.
Picture: Fonar Corporation.
| FONAR CORPORATION AND SUBSIDIARIES |
||
| June 30, | ||
| 2022 |
2021 |
|
| Current Assets: | ||
| Cash and cash equivalents | $ 48,722,977 | $ 44,460,411 |
| Short term investments | 32,326 | 32,177 |
| Accounts receivable – net of allowances for doubtful accounts of $204,597 and $442,270 at June 30, 2022 and 2021, respectively | 4,335,956 | 4,525,435 |
| Accounts receivable – related party | — | 11,977 |
| Medical receivables - net | 20,108,989 | 17,900,489 |
| Management and other fees receivable – net of allowances for doubtful accounts of $16,627,917 and $15,786,878 at June 30, 2022 and 2021, respectively | 33,419,219 | 30,947,863 |
| Management and other fees receivable – related party medical practices – net of allowances for doubtful accounts of $4,686,893 and $4,184,399 at June 30, 2022 and 2021, respectively | 8,602,561 | 7,814,250 |
| Inventories | 2,359,821 | 1,663,419 |
| Prepaid expenses and other current assets | 1,104,325 | 1,227,463 |
| Total Current Assets | 118,686,174 | 108,583,484 |
| Accounts receivable – long term | 1,871,890 | 2,879,946 |
| Deferred income tax asset | 12,842,478 | 15,958,961 |
| Property and equipment – net | 22,281,791 | 21,850,139 |
| Right-of-use-asset – operating lease | 34,232,109 | 30,133,285 |
| Right-of-use-asset – financing lease | 928,109 | 1,126,990 |
| Goodwill | 4,269,277 | 4,269,277 |
| Other intangible assets – net | 3,703,885 | 4,037,599 |
| Other Assets | 526,269 | 666,514 |
| Total Assets | $ 199,341,982 ================ |
$ 189,506,195 ================ |
| FONAR CORPORATION AND SUBSIDIARIES |
||
June 30, |
||
| 2022 | 2021 | |
| Current Liabilities: | ||
| Current portion of long-term debt and capital leases | $ 40,078 | $ 173,206 |
| Accounts payable | 1,551,269 | 1,866,035 |
| Other current liabilities | 6,417,227 | 9,162,118 |
| Operating lease liability – current portion | 3,880,129 | 3,533,656 |
| Financing lease liability – current portion | 210,140 | 202,741 |
| Unearned revenue on service contracts | 4,288,766 | 4,365,825 |
| Customer deposits | 361,245 | 731,101 |
| Contract liabilities | — | 14,739 |
| Total Current Liabilities | 16,748,854 | 20,049,421 |
| Long-Term Liabilities: | ||
| Unearned revenue on service contracts | 1,857,257 | 2,800,522 |
| Deferred income tax liability | 215,726 | 238,316 |
| Due to related medical practices | 92,663 | 92,663 |
| Operating lease liability – net of current portion | 33,090,990 | 28,975,132 |
| Financing lease liability – net of current portion | 838,291 | 1,048,431 |
| Long-term debt and capital leases, less current portion | 155,379 | 760,254 |
| Other liabilities | 106,541 | 171,331 |
| Total Long-Term Liabilities | 36,356,847 | 34,086,649 |
| Total Liabilities | 53,105,701 | 54,136,070 |
| Commitments, Contingencies and Other Matters | ||
| FONAR CORPORATION AND SUBSIDIARIES |
||
| June 30, | ||
| 2022 |
2021 |
|
| Stockholders’ Equity: | ||
| Class A non-voting preferred stock $.0001 par value; 453,000 shares authorized at June 30, 2022 and 2021, 313,438 issued and outstanding at June 30, 2022 and 2021 | $ 31 | $ 31 |
| Preferred stock $.001 par value; 567,000 shares authorized at June 30, 2022 and 2021, issued and outstanding – none | — | — |
| Common stock $.0001 par value; 8,500,000 shares authorized at June 30, 2022 and 2021, 6,565,853 issued at June 30, 2022 and 2021,6,554,210 outstanding at June 30, 2022 and 2021 | 657 | 657 |
| Class B convertible common stock (10 votes per share) $.0001 par value; 227,000 shares authorized at June 30, 2022 and 2021, 146 issued and outstanding at June 30, 2022 and 2021 | — | — |
| Class C common stock (25 votes per share) $.0001 par value; 567,000 shares authorized at June 30, 2022 and 2021, 382,513 issued and outstanding at June 30, 2022 and 2021 | 38 | 38 |
| Paid-in capital in excess of par value | 184,531,535 |
185,100,976 |
| Accumulated deficit | (33,566,757) |
(46,007,663) |
| Treasury stock, at cost – 11,643 shares of common stock at June 30, 2022 and 2021 | (675,390) | (675,390) |
| Total Fonar Corporation’s Stockholders’ Equity | 150,290,114 | 138,418,649 |
| Noncontrolling interests | (4,053,833) | (3,048,524) |
| Total Stockholders' Equity | 146,236,281 | 135,370,125 |
| Total Liabilities and Stockholders' Equity | $ 199,341,982 ================ |
$ 189,506,195 ================ |
| FONAR CORPORATION AND SUBSIDIARIES |
||
For the Years Ended
June 30, |
||
| 2022 | 2021 | |
| Revenues | ||
| Patient fee revenue – net of contractual allowances and discounts | $ 29,582,238 | $ 23,307,389 |
| Product sales – net | 517,939 | 1,288,483 |
| Service and repair fees – net | 7,590,865 | 7,638,608 |
| Service and repair fees – related parties – net | 110,000 | 110,000 |
| Management and other fees – net | 48,226,787 | 46,609,449 |
| Management and other fees – related party medical practices – net | 11,564,316 | 10,975,836 |
| Total Revenues – Net | 97,592,145 | 89,929,765 |
| Costs and Expenses | ||
| Costs related to product sales | 416,814 | 1,032,676 |
| Costs related to service and repair fees | 2,991,069 | 2,740,625 |
| Costs related to service and repair fees - related parties | 43,344 | 39,466 |
| Costs related to patient fee revenue | 13,307,819 | 10,917,635 |
| Costs related to management and other fees | 27,251,268 | 25,384,557 |
| Costs related to management and other fees – related party medical practices | 6,567,887 | 6,341,168 |
| Research and development | 1,494,181 | 1,635,979 |
| Selling, general and administrative, inclusive of compensatory element of stock issuances of $0 and $83,277 for the years ended June 30, 2022 and 2021 respectively | 23,512,581 | 24,740,044 |
| Total Costs and Expenses | 75,584,963 | 72,832,150 |
| Income From Operations | 22,007,182 | 17,097,615 |
| Other Income and (Expenses): | ||
| Interest Expense | (346,552 ) | (248,665 ) |
| Investment Income | 247,158 | 311,931 |
| Other income | 861,087 | 504,450 |
| Income before provision for income taxes and noncontrolling interests | 22,768,875 | 17,665,331 |
| Provision for Income Taxes | (5,534,487) | (3,991,520) |
| Net Income | 17,234,388 | 13,673,811 |
| Net Income – Noncontrolling Interests | (4,793,482) | (3,466,223) |
| Net Income – Attributable to FONAR | $ 12,440,906 ================ |
$ 10,207,588 ================ |
| Net Income Available to Common Stockholders | $ 11,690,796 ================ |
$ 9,592,134 ================ |
| Net Income Available to Class A Non-Voting Preferred Stockholders | $ 559,072 ================ |
$ 458,710 ================ |
| Net Income Available to Class C Common Stockholders | $ 191,038 ================ |
$ 156,744 ================ |
| Basic Net Income Per Common Share Available to Common Stockholders | $ 1.78 ================ |
$ 1.47 ================ |
| Diluted Net Income Per Common Share Available to Common Stockholders | $ 1.75 ================ |
$ 1.45 ================ |
| Basic and Diluted Income Per Share – Class C Common | $ 0.50 ================ |
$ 0.41 ================ |
| Weighted Average Basic Shares Outstanding – Common Stockholders | 6,554,209 ================ |
6,505,283 ================ |
| Weighted Average Diluted Shares Outstanding - Common Stockholders | 6,681,713 ================ |
6,632,787 ================ |
| Weighted Average Basic and Diluted Shares Outstanding – Class C Common | 382,513 ================ |
382,513 ================ |
| FONAR CORPORATION AND SUBSIDIARIES |
||
For the Years Ended
June 30, |
||
| 2022 | 2021 | |
| CASH FLOWS FROM OPERATING ACTIVITIES | ||
| Net income | $ 17,234,388 | $ 13,673,811 |
| Adjustments to reconcile net income to net cash provided by operating activities: |
||
| Depreciation and amortization |
4,535,236 | 4,081,687 |
| Provision for bad debts |
1,343,533 | 5,585,989 |
| Deferred income tax – net |
3,093,893 | 2,855,006 |
| Income tax receivable |
— | 671,185 |
| Amortization on right-of-use assets |
4,000,131 | 1,458,053 |
| Compensatory element of stock issuances | — | 83,277 |
| Stock issued for costs and expenses |
— | 1,940,821 |
| Abandoned patents |
— | 534 |
| Gain on forgiveness of PPP loan |
(700,764) | — |
(Increase) decrease in operating assets, net: |
||
Accounts, medical and management fee receivables |
(5,602,188) | (12,110,859) |
Notes receivable |
43,334 | 46,944 |
Contract assets |
— | 152,833 |
Inventories |
(696,402) | (14,649) |
Prepaid expenses and other current assets |
90,638 | 526,425 |
Other assets |
129,411 | (18,087) |
Increase (decrease) in operating liabilities, net: |
||
Accounts payable |
(314,766) | (99,224) |
Other current liabilities |
(3,765,215) | 1,382,497 |
| Customer advances | (369,856) | (123,478) |
Operating lease liabilities |
(3,437,743) | (965,825) |
Financing lease liabilities |
(14,739) | 14,739 |
| Other liabilities | (64,790) | 21,020 |
| NET CASH PROVIDED BY OPERATING ACTIVITIES | 15,301,360 | 19,088,001 |
| FONAR CORPORATION AND SUBSIDIARIES |
||
For the Years Ended
June 30, |
||
| 2022 | 2021 | |
| CASH FLOWS FROM INVESTING ACTIVITIES | ||
| Purchases of property and equipment | (4,545,292) | (3,533,091) |
| Proceeds of Short term investment |
(149) | (293) |
| Purchase of imaging center |
— | (1,122,508) |
| Purchase of noncontrolling interests |
(546,000) | — |
Cost of patents |
(87,882) | (163,705) |
| NET CASH USED IN INVESTING ACTIVITIES | (5,179,323) | (4,819,597) |
| CASH FLOWS FROM FINANCING ACTIVITIES: | ||
| Repayment of borrowings and capital lease obligations | (37,239) | (103,335) |
| Proceeds from debt | — | 63,000 |
| Distributions to noncontrolling interests | (5,822,232) | (6,570,000) |
| NET CASH USED IN FINANCING ACTIVITIES | (5,859,471) | (6,610,335) |
| NET INCREASE IN CASH AND CASH EQUIVALENTS | 4,262,566 | 7,658,069 |
| CASH AND CASH EQUIVALENTS - BEGINNING OF YEAR | 44,460,411 | 36,802,342 |
| CASH AND CASH EQUIVALENTS - END OF YEAR | $ 48,722,977 | $ 44,460,411 |